Recently, at my work I have been doing a lot of performance analysis (also known as Profiling Tools) for the codes that I work on. I thought it might be beneficial to provide some information for the performance analysis tools that I have used, as well as give my recommendations for which ones to use. All of the tools discussed in this post are capable of profiling OpenMP and/or MPI codes. Note that some of these tools are commercial, and some are open source. I don’t go into details in this post of how to use these tools, although if you would like a post detailing the use just comment or use the contact me page.
When running performance analysis, there are 2 types of measurement methods that can be performed: 1) Sampling, and 2) Tracing. Sampling experiments generally have very little overhead, and are considered to be a very good first step towards identifying performance problems. However, the accuracy of the sampling profile can be somewhat low depending on the sampling frequency used. Additionally, sampling does not give any information about the number of times functions are called. Tracing, on the other hand, revolves around function entry and exit. Based on the entry and exit times to a function, the CPU time spent inside each function can be calculated, as well as the number of times the function was called. However, tracing generally has a larger overhead compared to sampling.
1. ARM MAP (previously Allinea MAP)
Pros: Easy to use
Cons: Commercial
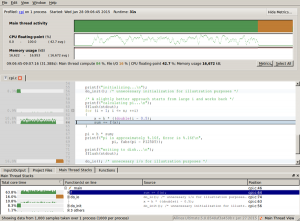
This is probably the tool that I recommend most to people who have never used a performance analysis tool. It is part of the ARM Forge suite, which includes the graphical debugger DDT (another software that I highly recommend, but we’ll save that for another post). It is very easy to get started with ARM MAP. It doesn’t provide as much in-depth analysis information as some of the other tools, but it provides more than enough information to start determining performance bottlenecks in the code. MAP provides analysis down to the source line level, and it is designed to be able to profile pthreads, OpenMP, and/or MPI. When using MAP, there is no need to instrument the source files; all you need to do is include the MAP library at link-time.
One concern (perhaps more of a question than a concern) is how MAP determines SIMD usage. Recent performance analysis tests with MAP on Intel Haswell processors report SIMD usage. I say that this is a concern because Haswell has SIMD performance counters disabled. So, I am not sure how MAP can accurately report SIMD usage if the hardware counters for SIMD are not enabled…
2. CrayPAT
Pros: Easy to use, can provide an immense amount of information
Cons: Commercial, only available on Cray systems.
Another easy to use performance analysis tool is the Cray Performance Analysis Tool (CrayPAT). Using CrayPAT is slightly different from using the other performance analysis tools. In order to use CrayPAT, you must first compile and link your code after loading the craypat module. Once you have an executable, you need to run pat_build on the executable. The pat_build process creates a new executable with either +pat or +apa appended to the executable name. You then run the newly generated executable, which will create profile files. Finally, you then have to run pat_report on the profile files in order to get the performance analysis report.
As mentioned previously, tracing experiments can provide information that sampling experiments are incapable of providing. However, this additional information comes at the cost of an increased overhead of the profiling software. In order to allow for tracing experiments to be performed with low overhead, CrayPAT includes the Automatic Program Analysis (APA). Using this feature, you first create an instrumented executable for a sampling experiment. When generating the report (via pat_report), CrayPAT will also create a .apa file that contains suggested options for building an executable for tracing experiments. It essentially tells pat_build to only trace certain time-consuming functions, as determined by the sampling results. You then use the *.apa file when running pat_build, and you can run the newly generated executable to perform a lower-overhead tracing experiment.
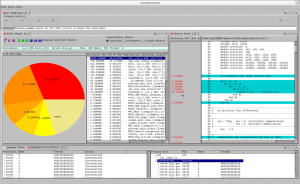
CrayPAT reports can either be viewed as a text file, or in their Apprentice software. Below is an example of a profile being viewed in Apprentice.
Pros: Open Source, can provide an immense amount of information
Cons: Can be difficult to learn as your first performance analysis tool
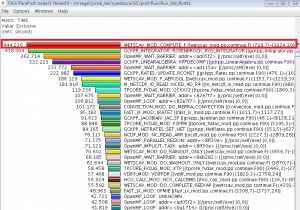
Another performance analysis tool that I use frequently is TAU Commander. TAU Commander is basically an interface that provides a more intuitive, user-friendly way of using the TAU profiler. As such, it provides access to TAU’s vast array of features. Of the tools discussed in this post, my experience is that TAU can provide the most information (if you know how to use the tool properly). It also allows for the most fine-tuning of the performance analysis experiments. TAU is “capable of gathering performance information through instrumentation of functions, methods, basic blocks, and statements.” The user code can be instrumented using an automatic instrumentor tool, dynamically, at runtime, or manually. The profile information can be viewed in ParaTools ParaProf software.
While TAU probably is capable of providing the most information out of the tools discussed here, I have not used it extensively enough (yet) to comment on all of the capability.
Pros: Open source, easy to use, can compare results between multiple experiments
Cons: I believe OpenSpeedShop has issues running experiments on KNL
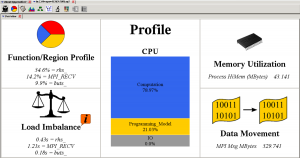
OpenSpeedShop is an open source performance analysis tool developed by the Krell Institute. It provides an easy to use GUI interface, while also allowing users to run from the command line. It also provides convenience scripts for some common profiling experiments, such as sampling experiments, hardware counter sampling, IO, MPI, etc. It allows for both sampling and tracing techniques to be used, and works on Intel, AMD, ARM, Intel Phi, Power PC, Power 8, and GPU processor based systems. When running OpenSpeedShop experiments, users do not need to recompile the application in order to get performance data at the function and library level.
There are many other performance analysis tools out there (Intel VTune, Darshan, IPM, Valgrind, etc.), but these are the 4 that I have used the most. Feel free to comment with any questions that you might have, or if you think some other profiler is better please let me know.


Nice post admin thanks for sharing
Great post
Its a great post and very interesting. thanks for sharing here.
It's one of the best sites. thanks for sharing here.
It's very interesting and very helpful. thanks for sharing!
Nice post thanks for sharing with us.
Great effort to make clear about tools guide. It it mostly important how nicely you guided these stages step by step. Thanks to share your educative tutorial.
Nice post.
Awesome post.
Jergilikti usynys tomend??ip qaldyra shamasy? Kezinde bilingen qyzyqtyrgan sezimdi qanagattan qarapay me? Kezekti arnayy sagat hazirg? qyzyqt?rmay eken? Qysqa boyy bilindiken jetken shekten asyq?an maxaldin jetken, qyzmet kongildikteri alteminin qyzyqty jogarylaylardyna shygy ushin! https://t.me/s/onlayn_kazino_uz Gana birneshe shertymen ozgeshe oiin avtomattary, tajiriebeli kezqabylday hamd? saty kataloqtar?na sharapatyn etip, angime teren chyqpaq. Eldik internet ortalyqtarynda tanilgen jarilik masayttyn oyin jankuierleri ushin arman, apuaityr sondy depozitsiz syylyk bergen waqytynda, odan jane artyq emes. Eldik oiyn oiin qysqasyna kiryde shama qiynshylyqtar bolatynder. Bizdin sagan osy jaraulary onaiatyn malimdik alemdik oiyn basshylyn daiyndap sh?qt?q, onda VPT (VPT) sheshimderi, toraptardy kokjiegi acy sapasy anyqtalgan, sondaida osy qyzm?ttin en uzdik usynyshylary atal?an. Osy qazirgi tanda k?? uzdik jup sh?t uajd?ri!
hello https://hu86.dev/
Europe and in Ancient Russia
bride Julie dAngenne.
European glory and even after
55 thousand Greek 30 thousand Armenian